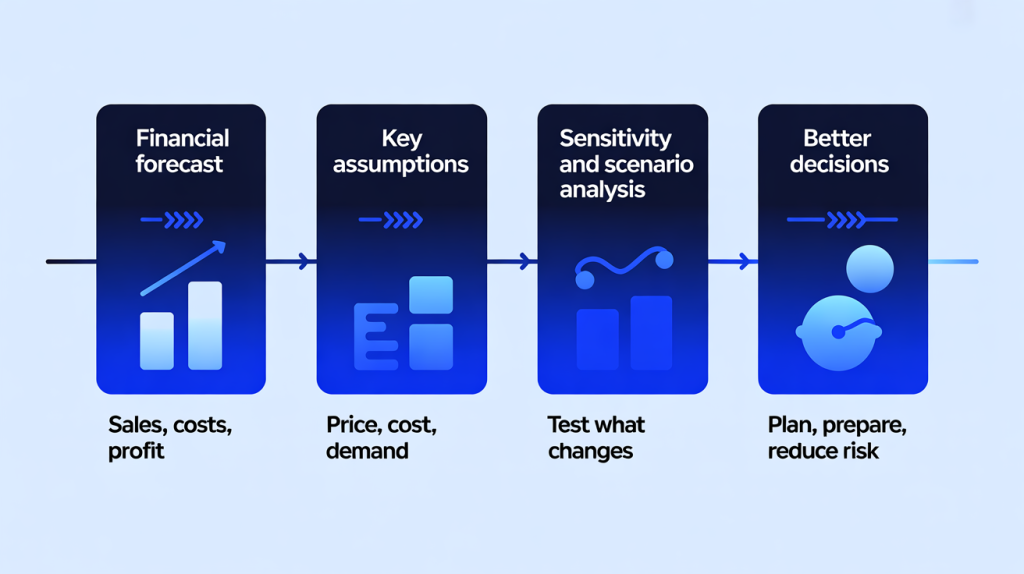
When forecasting a business’s future financials, you rely on many assumptions and none of them are ever 100% accurate. This uncertainty makes financial planning challenging.
To deal with it, companies use two important tools: sensitivity analysis and scenario analysis. These tools help businesses understand how financial results may change when assumptions shift.
Sensitivity analysis shows you exactly what happens when revenue dips slightly or when costs rise unexpectedly. It’s simple, powerful, and honestly one of the most underrated skills in finance today.
When you combine it with strong scenario planning, you gain the ability to predict future outcomes more confidently and make decisions with far greater clarity.
This guide explains sensitivity and scenario analysis in finance using real business examples from different industries. So lets start.
What Is Sensitivity Analysis in Finance
Sensitivity analysis in finance is a method used to understand how a financial outcome changes when one or two inputs change while all other inputs remain the same.
In simple words, it checks how sensitive profit, revenue, or cash flow is to changes in one or two key variables such as price, cost, demand, or production.
Why Companies Use this?
Companies use sensitivity analysis in finance to:
- Identify the most risky assumptions
- Understand which variable impacts profit the most
- Test the strength of finance models
- Improve decision-making
- Communicate risk clearly to management and investors
Because of this, sensitivity analysis finance is widely used in corporate finance, valuation, budgeting, and Excel forecasting.
How Can We Build Sensitivity Analysis Step by Step?
A simple approach looks like this:
Step 1: Build a base financial projection. This is your expected case.
Step 2: Choose one or two key variables. Example price, cost, demand, or production.
Step 3: Change only that variable. Increase it or decrease it by a small amount.
Step 4: Observe how revenue, profit, or cash flow changes by that one previous change.
Step 5: Repeat that for other key variables as well.
This process helps identify which assumptions are most critical in finance models.
In real finance models, sensitivity analysis finance is usually built using Excel forecasting. This short video shows how sensitivity analysis is practically done in Excel using real financial models:
Sensitivity Analysis Finance Example Using an Oil Company
An oil company’s revenue depends mainly on two things:
- Quantity of oil produced
- Oil prices in the international market
Both factors are uncertain and outside the company’s control.
Base Projection
- Oil production: 1 million barrels
- Oil price: 80 dollars per barrel
- Cost: 50 dollars per barrel
Profit = (80 minus 50) multiplied by 1 million = 30 million dollars
Sensitivity Analysis on Oil Price
- If the oil price falls to 70 dollars, profit becomes 20 million dollars
- If the oil price rises to 90 dollars, profit becomes 40 million dollars
Only one variable changed: Oil price.
This shows how sensitive profit is to oil prices.
Sensitivity Analysis on Production
If production falls to 0.9 million barrels, profit becomes 27 million dollars
If production rises to 1.1 million barrels, profit becomes 33 million dollars
This shows how production uncertainty impacts profitability.
This is a sensitivity analysis in finance in practice.
What Is Scenario Analysis in Finance
Scenario analysis in finance is a method used to evaluate how a business will perform under different possible future situations.
It works by changing multiple assumptions at the same time such as prices, costs, demand, or production and then observing how revenue, profit, or cash flow changes under each situation.
In simple words, scenario analysis does not ask what happens if one thing changes.
It asks what happens if several things change together, which is how real business conditions usually work.
Because of this, scenario planning is used to build:
- Best case scenarios
- Base case scenarios
- Worst case scenarios
This helps companies understand the range of possible outcomes, not just individual risks.
Why Is This Method Used by Companies?
Companies use scenario planning to:
- Understand future risk clearly
- Prepare action plans for different situations
- Avoid overconfidence in forecasts
- Improve long-term strategy
- Communicate uncertainty to investors
Because of this, scenario planning is widely used in risk management, strategic planning, and capital allocation.
How to Build Scenario Analysis Step by Step?
Step 1: Identify key variables that affect results.
Step 2: Decide realistic values for each variable.
Step 3: Combine variables to create scenarios.
Step 4: Calculate financial results for each scenario.
Step 5: Compare outcomes and plan responses.
Scenario Analysis Example Using the Same Oil Company
Using the same above oil company example:
Best Case Scenario
- Oil price is 90 dollars
- Production 1.1 million barrels
- Cost remains stable
Profit = 44 million dollars
Base Case Scenario
- Oil price is 80 dollars
- Production 1 million barrels
Profit = 30 million dollars
Worst Case Scenario
- Oil price is 65 dollars
- Production: 0.9 million barrels
- Cost rises to 55 dollars
Profit = 9 million dollars
This clearly shows how uncertainty can significantly change outcomes. Scenario planning helps management prepare for such changes.
Advantages and Limitations of Sensitivity & Scenario Methods
| Advantage | Limitations |
| Improves forecasting accuracy | Depends on assumptions |
| Identifies key risk drivers | Cannot predict the exact future |
| Strengthens finance models | Poor inputs lead to poor results |
| Supports better decisions | – |
| Enhances Excel forecasting credibility | – |
Sensitivity analysis finance and scenario planning are tools, not guarantees.
Comparison Table
| Feature | Sensitivity Analysis Finance | Scenario Planning |
| Variables changed | One or two at a time | Multiple together (more than two) |
| Purpose | Identify key risks | Understand future outcomes |
| Complexity | Simple | Moderate |
| Best use | Model testing | Strategic planning |
Why Companies Use Sensitivity & Scenario Together
Every financial projection is built on assumptions. Companies assume how fast sales will grow, what prices they can charge, how stable costs will be, and how demand will behave. In reality, these assumptions rarely stay fixed. For example, Raw material prices change, oil prices fluctuate, customer demand moves up and down, interest rates rise, and exchange rates shift.
Sensitivity analysis finance helps companies understand this uncertainty at a basic level. It answers a simple but important question: “What happens to revenue or profit if one or two key assumptions change?” For example, “what happens if oil prices increase or if production falls slightly?” This helps identify which assumption has the biggest impact on financial results and where the main risk lies.
However, real business situations are rarely that simple. Changes usually happen together. Costs may rise at the same time demand weakens. Prices may fall while interest rates increase. This is where scenario planning becomes necessary. Scenario planning looks at multiple changes (more than two) happening at once and shows how the business performs under different possible future conditions.
When companies use sensitivity analysis finance and scenario planning together, their finance models become more realistic. Excel forecasting improves because it reflects uncertainty instead of relying on a single fixed forecast. This combined approach allows management to prepare for different outcomes, reduce surprises, and make stronger financial decisions. That is why professional analysts and companies rely on both tools together, not separately.
Different Industry Examples
- Automobile Industry
Here, revenue depends on vehicle demand because the number of cars sold directly determines sales income. Profit depends on steel and aluminum prices because these materials make up a large share of manufacturing costs.
Sensitivity analysis finance helps measure the impact of raw material price changes even when sales increase.
- Aviation Industry
Airlines like IndiGo depend heavily on fuel prices because aviation fuel is the largest operating expense and strongly influences total costs.
Scenario planning helps understand profit changes when oil prices rise and demand falls together.
- FMCG Companies
Input costs like wheat, sugar, and oil fluctuate because these commodities are affected by supply, weather conditions, and global market prices, which directly impact production costs.
Sensitivity analysis finance shows how margins change due to commodity prices.
- Power Companies
Coal and gas prices affect profitability because fuel expenses account for a major portion of electricity generation costs.
Scenario planning helps manage fuel price risk and demand uncertainty.
These examples show why sensitivity & scenario analysis in finance is used across industries.
Common Mistakes to Avoid
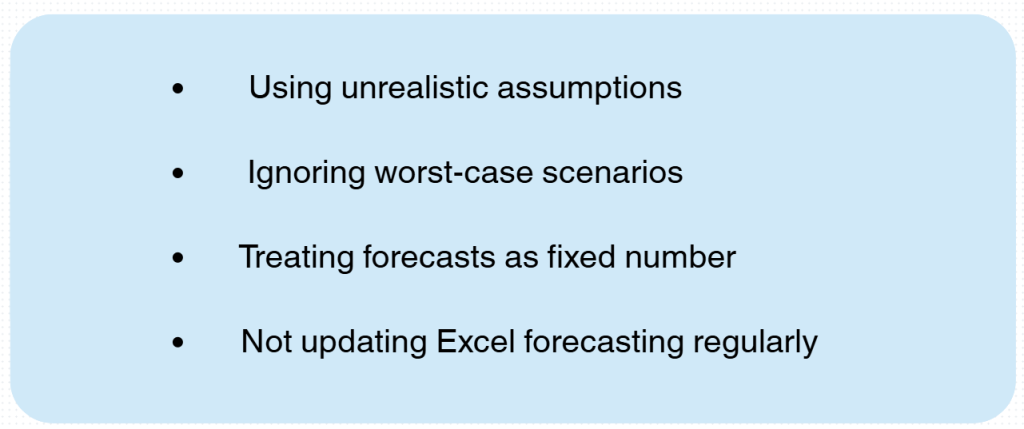
Avoiding these mistakes improves the reliability of finance models.
The Verdict
Financial forecasting is not about predicting the future perfectly. It is about preparing for uncertainty.
Sensitivity analysis finance helps understand how individual assumptions affect results. Scenario planning helps understand how multiple uncertainties work together.
Oil companies, automobile firms, aviation companies, and FMCG businesses all face uncertainty. They manage it using sensitivity analysis finance, scenario planning, Excel forecasting, and structured finance models.
These tools turn uncertainty into informed planning. That is why they are essential in modern finance.
And if you want to learn all of these in depth, The Wallstreet School’s Financial Modelling and Valuations Course focuses on how forecasting is actually done in real finance work.
People Also Ask
1. What is the purpose of sensitivity and scenario analysis?
Ans. They let you check how your money numbers shift when reality changes, so you can choose the safest and smartest moves.
2. What is a scenario analysis?
Ans. It compares different future situations like best, base, and worst cases to show how your financial results might change.
3. What is a sensitivity scenario?
Ans. A sensitivity scenario tests one input change at a time, like price or churn, to see its exact impact on financial outcomes.
4. What is the difference between scenario manager and sensitivity analysis?
Ans. Scenario Manager tests multiple input sets together. Sensitivity analysis changes one input at a time to show its direct financial impact.