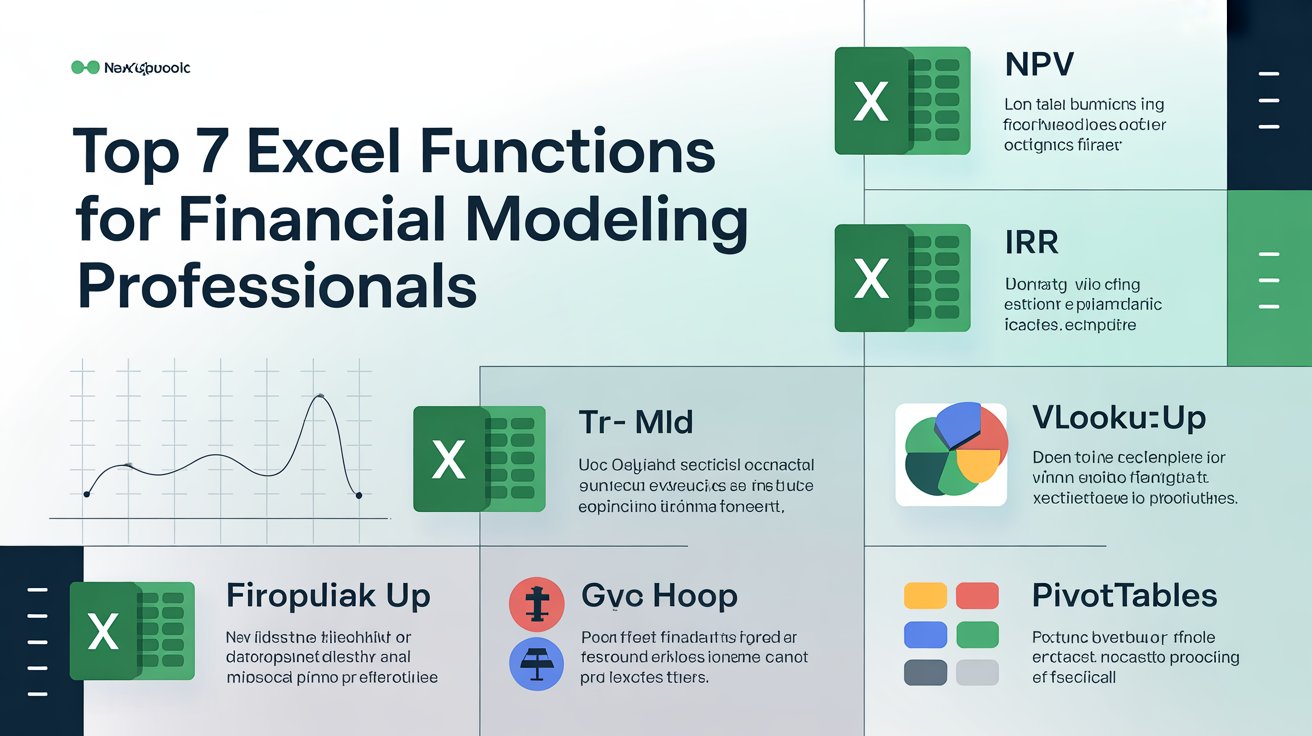
If you are working in finance or preparing for a career in financial modelling, Excel will probably be your most-used tool. From creating projections to analysing complex datasets, Excel functions make the process faster and more accurate. Knowing how to use the right formulas can help you save hours every week. In this blog, we’ll look at the top 7 Excel functions for financial modelling professionals and how you can apply them in real-world models.
Understanding these functions will help you use Excel for Financial Modelling more effectively and prepare you for future roles that involve data analysis in 2025 and beyond.
1. VLOOKUP and HLOOKUP
When dealing with large datasets, finding a matching value across columns can take time. That’s where the VLOOKUP function helps. It searches for a value vertically in a column and returns a corresponding value from another column.
For horizontal data, the HLOOKUP function works the same way but looks across rows.
Here’s the syntax for VLOOKUP:
=VLOOKUP(lookup_value, table_array, col_index_num, [range_lookup])
Example:
If you want to find a product’s price using its code, VLOOKUP can search through a table and fetch the correct price instantly.
VLOOKUP and HLOOKUP are very common in Excel for Financial Modelling, especially when linking data from different sheets such as income statements, balance sheets and assumptions tabs.
2. INDEX and MATCH
While VLOOKUP is popular, it has some limits. For example, it can only search for values in the first column of a table. In such situations, a combination of INDEX and MATCH gives you more flexibility.
- INDEX returns a cell value based on its row and column position.
- MATCH locates the position of a specific value within a row or column.
When combined, they allow you to find data in any direction.
Here’s how to use them together:
=INDEX(array, MATCH(lookup_value, lookup_array, 0))
Example:
If you are building a valuation model and need to pull historical EPS data from multiple years, this combination helps you reference data dynamically.
These two functions are part of almost every CFA Excel tools list because they improve data accuracy and model flexibility.
3. SUMIFS and COUNTIFS
If you want totals or counts based on certain criteria, SUMIFS and COUNTIFS are essential.
These functions help you apply multiple conditions while summing or counting data, which is often required in data analysis 2025 scenarios like dynamic dashboards or financial reports.
Example:
Suppose you want to calculate total sales for a particular region and month, SUMIFS can handle that easily.
Formula:
=SUMIFS(C2:C15, A2:A15, “North”, B2:B15, 2025)
Explanation:
- C2:C15 → range that contains the revenue values
- A2:A15 → range containing regions
- “North” → first condition (Region = North)
- B2:B15 → range containing years
- 2025 → second condition (Year = 2025)
This formula gives total revenue for the North region in 2025, which is very common in financial modelling while preparing regional forecasts.
COUNTIFS Formula Example
Purpose: To count how many projects earned more than ₹50,000 profit in 2025.
Formula:
=COUNTIFS(B2:B15, 2025, C2:C15, “>50000”)
Explanation:
- B2:B15 → range containing years
- 2025 → condition for the year
- C2:C15 → range containing profit values
- “>50000” → condition for profit greater than ₹50,000
This formula returns the number of projects in 2025 with profit greater than ₹50,000, which is useful for profitability or performance tracking models.
4. IF Statement
The IF statement in Excel is one of the most used logical functions in financial modelling. It helps you test a condition and return a specific result based on whether that condition is true or false. Analysts often rely on it to classify data, check conditions or make quick decisions inside a financial model.
Here’s the basic syntax of the IF formula:
=IF(logical_test, value_if_true, value_if_false)
Let’s understand this with a simple example. Suppose you want to identify whether a project is profitable or not based on its profit figure.
Formula:
=IF(B2>50000, “Profitable”, “Not Profitable”)
Explanation:
- B2>50000 checks whether the profit is greater than ₹50,000
- “Profitable” appears if the condition is true
- “Not Profitable” appears if the condition is false
This simple logic can quickly help you flag projects, check performance or trigger alerts when targets are not met. In a financial model, IF statements can simplify decision-making, for example, marking whether a company should invest further in a segment based on profitability.
As you start working with more complex datasets, the IF formula can be combined with AND or OR to test multiple conditions at once, such as checking both revenue and margin targets before making a decision. These combinations make the IF statement a powerful foundation for dynamic financial analysis.
5. OFFSET with AVERAGE or SUM
The OFFSET function in Excel returns a range of cells that is a specific number of rows and columns away from a reference point. When combined with functions like SUM or AVERAGE, it becomes very useful in financial modelling, especially for dynamic calculations such as rolling averages or flexible range-based totals.
Here’s the basic syntax of the OFFSET formula:
=OFFSET(reference, rows, cols, [height], [width])
This means Excel starts from the reference cell, moves down or across by the given number of rows and columns and returns a range with the specified height and width.
Let’s look at a practical example that’s relevant in financial modelling.
Example:
Suppose you’re calculating a 3-month rolling revenue average.
Formula:
=AVERAGE(OFFSET(C5,0,COUNT(B2:B4)-3,1,3))
Explanation:
- C5 → starting cell of the revenue series
- COUNT(B2:B4)-3 → defines the offset dynamically based on how many months of data are available
- 1,3 → height and width that define a 3-cell range for averaging
- The AVERAGE function then calculates the mean of the last 3 months automatically
This approach allows you to create flexible, auto-updating formulas useful when new months or data points are added to your financial model.
You can also use OFFSET with SUM to create a moving total instead of an average.
Formula:
=SUM(B4:OFFSET(B4,0,E2-1))
Explanation:
- B4 → first cell in the data range
- E2 → cell defining how many columns to include
- The formula dynamically adjusts the sum range as you change the number in E2
This is helpful when you want to build dashboards or models that automatically adapt when the time period or data range changes without manually editing cell references.
6. Data Validation
In financial modelling, accuracy is important. The Data Validation feature in Excel helps control what type of data users can enter into a cell. It is not a formula but an important tool for maintaining clean and consistent data in a model.
Data validation limits inputs to certain types of values. It can restrict numbers to a range, allow only dates, or create a list of options.
For example, you may want users to select a financial category such as Revenue, Expense, or Investment from a dropdown instead of typing it.
Steps to apply Data Validation:
- Select the cell or range where you want to apply validation, for example D2:D10.
- Go to the Data tab on the Excel ribbon.
- Click Data Validation from the dropdown.
- Under Allow, choose List.
- In the Source box, type the items you want :
Revenue, Expense, Investment - Click OK.
Each selected cell will now show a small dropdown arrow that lets you pick from the list.
This is useful in financial models where wrong entries can lead to errors. For example, typing “Revnue” instead of “Revenue” can give wrong results. Data validation helps avoid such issues by allowing only correct values.
Example Use Case:
An analyst preparing a company’s budget can use data validation to ensure only valid cost centers or regions are entered. This keeps the data uniform and easy to analyze later.
7. Data Table
A Data Table in Excel is a simple tool that helps you see how changing one or two variables affects your results. It is mostly used for sensitivity analysis in financial models.
Example:
Imagine you want to know how different interest rates affect your EMI on a loan.
- Enter your loan amount, rate, and tenure in cells.
- Write the formula for EMI using PMT() in one cell.
- Create a table listing different interest rates in one column.
- Go to Data > What-If Analysis > Data Table.
- In the dialog box, select the input cell linked to your interest rate.
Excel will automatically calculate EMIs for all the rates you listed.
Result:
You can quickly see how your EMI changes if the interest rate increases or decreases.
Formula used:
While Data Table does not use a direct formula, it works along with formulas like PMT, NPV, or IRR to display different results based on input changes.

1. Data Table with PMT
Goal: Find how different interest rates affect your monthly EMI.
Step-by-step:
- In cell B1, type Loan Amount = 500000
- In cell B2, type Tenure (Years) = 5
- In cell B3, type Interest Rate = 10%
In cell B4, write the formula for EMI:
=PMT(B3/12, B2*12, -B1)
- Below the formula, create a list of interest rates like 8%, 9%, 10%, 11%, 12% in a column.
- Select the range including the formula and rate list.
- Go to Data → What-If Analysis → Data Table.
- In the dialog box, choose Column Input Cell = B3 (since your interest rates are listed vertically).
Result:
Excel will show different EMI amounts for each interest rate.
2. Data Table with NPV
Goal: See how changing discount rates impact the Net Present Value of cash flows.
Step-by-step:
- Enter cash flows in cells B2:B6 (example: -100000, 30000, 40000, 50000, 60000).
- In C1, type “Discount Rate”.
3. In C2, write the base formula:
=NPV(C2, B3:B6) + B2
- Below the formula, list different discount rates like 8%, 10%, 12%, 14%, 16%.
- Select the range covering the formula and the list.
- Go to Data → What-If Analysis → Data Table.
- Set Column Input Cell = C2.
Result:
Excel will calculate NPV for each discount rate automatically.
3. Data Table with IRR
Goal: Check how changing initial investment impacts the IRR.
Step-by-step:
- Enter cash flows in B2:B6 (for example, -100000, 25000, 30000, 35000, 40000).
2. In C1, type:
=IRR(B2:B6)
3. Create another column with different initial investments (like -80000, -90000, -100000, -110000, -120000).
4. In the first cell of that column’s header, link it to B2 (your initial investment cell).
5. Select the range that includes the IRR formula and investment list.
6. Go to Data → What-If Analysis → Data Table.
7. Set Column Input Cell = B2.
Result:
Excel shows how IRR changes as your initial investment amount changes.
Conclusion
Learning Excel functions is not just about formulas, it’s about understanding how to use them in real business situations. These top 7 Excel functions for financial modelling professionals help you analyze data faster, reduce errors and create more dynamic models.
We at The Wall Street School, focus on helping students apply these Excel tools in real financial modelling and valuation projects. Every concept is taught using live examples from equity research, investment banking, and corporate finance so that students learn how to use these functions in the same way analysts do at work.
Whether you are preparing for the CFA, building your first model, or handling client data, mastering Excel for Financial Modelling can improve your productivity and confidence in handling financial data. Excel remains the backbone of finance, and with data-driven roles increasing in 2025, learning these formulas can help you stay ready for your next step in a finance career.
People Also Asked
1. What Excel functions do you use most frequently in financial modelling?
Ans. SUM, IF, VLOOKUP/XLOOKUP, INDEX-MATCH, SUMIFS, and NPV/IRR.
2. What are the 7 basic Excel formulas?
Ans. SUM, AVERAGE, COUNT, IF, VLOOKUP, INDEX-MATCH, and SUMIF
3. What are the 5 main functions of Excel?
Ans. Store data, calculate stuff, analyse trends, visualise info with charts, and keep everything organised in neat tables.