
Because Excel alone cannot handle large-scale data, automation and real time reporting, while financial modeling with Python and Power BI creates faster, scalable and more reliable finance systems.
Finance teams are not working the same way they did five years ago. Data volumes have grown, reporting timelines have shortened and business leaders now expect real-time visibility into numbers that used to take weeks to compile.
That pressure has pushed Python and Power BI for finance professionals straight to the center of the conversation. Excel is not going away. But relying on it alone is no longer enough to stay competitive in a data-driven environment. Understanding how these tools connect is now one of the core finance analytics skills any analyst needs in their toolkit.
Why Excel Alone Is Not Enough Anymore?
Excel has been the default tool in finance for decades. It handles three-statement models, scenario analysis and budgeting tables with ease. Most finance departments still trust it deeply, and for good reason. The problem is not Excel itself. The problem is using Excel for jobs it was never designed to handle at scale.
Spreadsheets holding millions of rows slow down or break. Manual data refreshes introduce errors. File version control becomes a mess when multiple people work on the same model simultaneously. These problems get worse as companies scale up.
This is where the Excel vs Python finance discussion becomes relevant. When finance leaders ask whether Python replaces Excel, the short answer is no. What Python does is fill in the gaps that Excel cannot handle on its own. The Excel vs Python finance divide is really a question of which tool handles which task, not which tool wins. At the same time, Power BI for accountants adds a reporting and communication layer that static spreadsheets simply cannot deliver.
Finance analytics skills in 2026 are built around knowing which tool to use for which job and how to connect them all without friction.
What Each Tool Does in a Finance Team?
Understanding each tool’s specific role is the starting point for finance analytics skills that hold real value in 2026.
- Excel remains the modeling backbone. Analysts build valuation models, budget templates and sensitivity tables inside Excel. It is intuitive and widely trusted across departments. The issue is not what Excel can do in isolation. The issue is what it cannot scale across large datasets or repeatable automated workflows.
- Python is where financial modeling tools 2026 are evolving most noticeably. With libraries like pandas and numpy, Python can clean and process large datasets in seconds. It runs Monte Carlo simulations, builds regression-based forecasting models and automates repetitive tasks that used to consume hours of analyst time. The Excel vs Python finance debate often assumes these tools compete. In practice, Python extends what Excel does. For any finance professional exploring financial modeling tools 2026, Python belongs at the top of the list of things to learn.
- Power BI is the reporting and visualization layer. Power BI for accountants is especially useful because it turns model outputs into interactive dashboards that non-technical stakeholders can actually navigate. Executives can filter by region, product line or time period without touching a single formula. Reports refresh automatically when new data flows in from connected sources. Power BI for accountants also integrates with Microsoft Fabric, making AI-enhanced visuals and forecasting tools increasingly accessible to finance teams.
Together, Python and Power BI for finance professionals create a workflow that is faster, more reliable and far easier to share across the organization.
How the Three-Tool Workflow Comes Together?
The clearest way to understand this stack is to walk through a straightforward revenue forecasting process from start to finish.
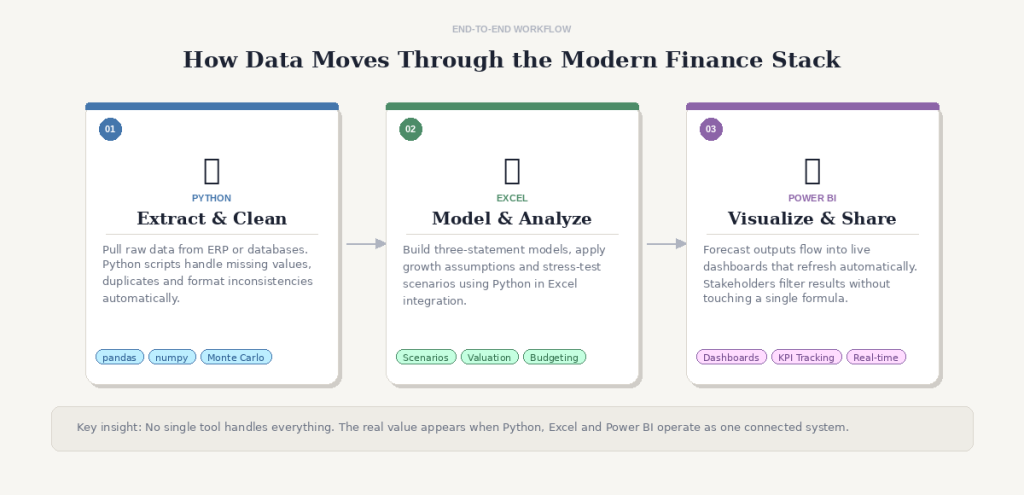
Figure 1: How data moves through the modern finance stack from raw extraction in Python, to structured modeling in Excel, to live reporting in Power BI.
- Data preparation is the first step. Sales data is pulled from an ERP system or company database. Python scripts clean the data automatically, handling missing values, removing duplicates and standardizing formats across sources. This step alone can save analysts several hours each month.
For anyone developing finance analytics skills in 2026, the ability to automate data cleaning sits near the top of what employers value most right now.
- Modeling is the second step. The cleaned data moves into Excel, either directly or through Python in Excel integration. Growth rate assumptions are applied. Cost ratios and working capital changes are calculated. Scenarios can be stress-tested using Python’s forecasting libraries without leaving the spreadsheet environment.
This is where financial modeling tools 2026 look meaningfully different from what most teams used just three years ago. The combination of Python’s analytical depth and Excel’s familiar structure is where the real productivity gains appear.
- Reporting and visualization is the final step. Forecast outputs connect directly to Power BI. Dashboards display revenue trends, margin forecasts and key performance indicators in a format that refreshes in real time. Power BI for accountants removes the friction of sending static Excel files back and forth through endless email chains. Everyone works from the same live data source, which reduces confusion and speeds up decisions at every level of the organization.
This end-to-end approach is exactly what Python and Power BI for finance professionals are built to support.
Comparing the Tools Side by Side
| Tool | Strength in Finance | Limitation Alone | Best Use Case |
| Excel | Flexible formulas, scenario testing | Manual updates, size limits | Core financial models |
| Python | Automation, simulations, large data | No native dashboards | Forecasting and risk analysis |
| Power BI | Interactive dashboards, real-time data | Limited complex modeling | Reporting and KPI tracking |
The real value of financial modeling tools 2026 is not found in any single tool. It lives in how smoothly these three work as one connected system. Finance analytics skills built around this combination are what separate strong candidates from average ones in today’s hiring market.
The Business Case for Adopting This Stack
Finance teams that adopt this combination see measurable, real-world results.
Efficiency and accuracy gains:
- Automating financial processes can cut task time by 30 to 40% with some organizations completing processes up to 85 times faster
- Finance professionals using automation tools spend 20 to 30% less time on data work, freeing them for higher-value analysis
- Workflow automation is linked to a 30 to 40% drop in compliance reporting time and up to a 90% reduction in reporting errors
Collaboration and visibility:
Power BI for accountants creates a shared source of truth. Power BI is used by 97 percent of Fortune 500 companies and has over 30 million active monthly users globally. Instead of multiple spreadsheet versions circulating through email, there is one live dashboard that everyone accesses and trusts.
Hiring and career impact:
- 61% of finance and accounting hiring managers say finding skilled professionals is significantly harder than a year ago, largely due to the gap between Excel-only profiles and the analytics skills companies now expect
- Over 1.19 million LinkedIn job listings required Python skills in 2026, with Python appearing in 15 to 18% of all job postings according to IT Support Group
Finance analytics skills in automation and visualization have moved from a bonus to a baseline expectation across most finance job descriptions today.
2026 Trends Making This Stack More Relevant
Several developments in 2026 are making Python and Power BI for finance professionals more practical and necessary than ever.
AI is now built directly into the tools:
- Power BI’s Copilot enables AI-assisted forecasting, anomaly detection, and natural language queries without deep technical knowledge
- Python’s StatsForecast library fits millions of time series models in under five minutes, with AutoARIMA and anomaly detection out of the box
- Gartner research found that companies using predictive analytics average a 21% revenue increase over three years versus those relying only on historical data
Cloud and the Excel vs Python finance shift:
70 percent of finance teams now run on cloud-based platforms, with models refreshing daily or hourly instead of monthly. According to IBM’s FP&A 2026 Trends report, finance professionals are actively expanding into data science and AI-driven planning. The teams getting the most from financial modeling tools 2026 are the ones treating Excel, Python and Power BI as one system, not three separate tools.
A Practical Learning Path
Finance professionals who want to build Python and Power BI for finance professionals expertise do not need to become software engineers. The goal is to develop enough fluency to automate common tasks and connect tools effectively.
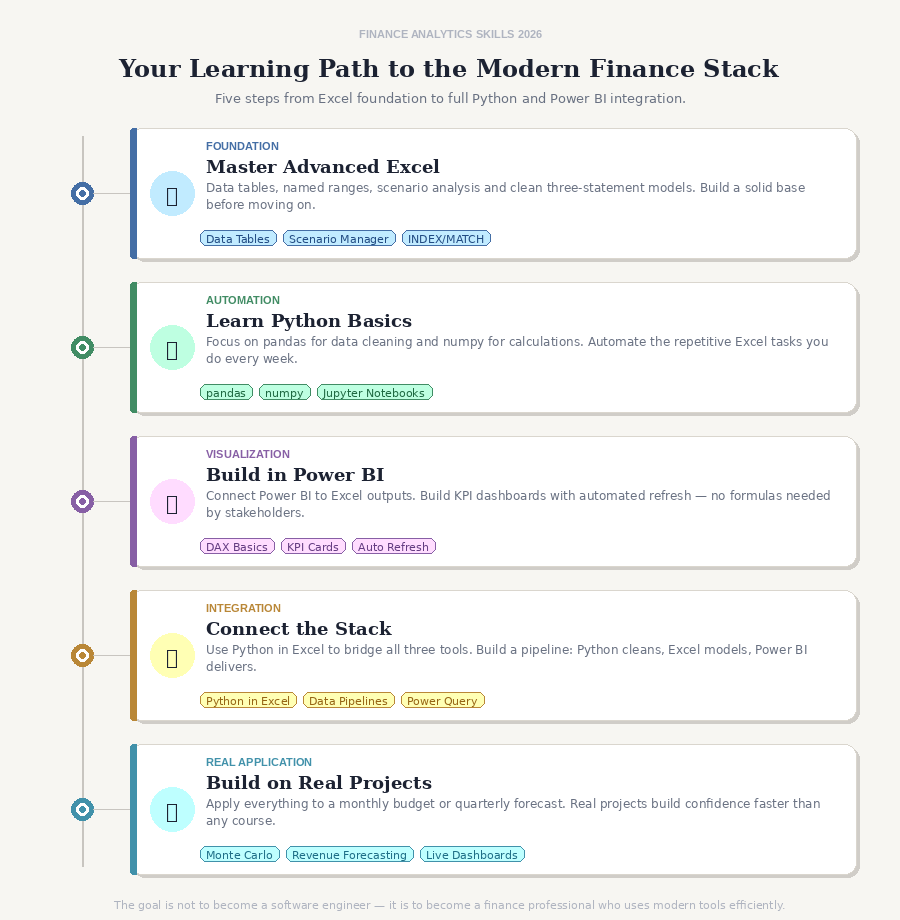
Figure 2: A five-step learning path for finance professionals moving from Excel foundations to full Python and Power BI integration.
A practical starting point is to master advanced Excel first, particularly data tables, named ranges and scenario analysis. From there, learning Python basics with a focus on pandas for data cleaning and simple forecasting builds a strong foundation. Power BI for accountants can be introduced next, starting with connecting to Excel outputs and building straightforward dashboards.
The key is working on real problems. Running a Python data pipeline into an Excel model and pushing outputs into a Power BI dashboard on a real business report, such as a monthly budget or a quarterly revenue forecast, builds practical confidence faster than any course alone can achieve.
Python and Power BI for finance professionals are not optional additions in 2026. The professionals who develop these finance analytics skills now will be the ones leading teams and shaping financial decisions in the years ahead.
People Also Ask about financial modeling with Python and Power BI
1. Is Python replacing Excel in 2026?
No. Excel remains central to finance work. Python enhances it by adding automation and advanced analytics capabilities.
2. Why is Power BI important for financial analysts?
Power BI allows real-time dashboards, automated refresh and interactive reports. It improves communication and decision-making.
3. What skills matter most for financial analysts in 2026?
Strong Excel modeling, Python for data automation and dashboard skills in Power BI define key financial analyst skills 2026.
Final Thoughts
We started by talking about pressure. Tighter deadlines, bigger datasets, leaders who want answers faster than spreadsheets can deliver. That pressure is not going away.
The finance professionals who come out ahead are not always the most technical. They are the ones who learn the right tools before they are forced to. Python and Power BI for finance professionals are not about chasing trends. They are about making your work faster, cleaner and more reliable. Start small. Automate one report. Build one dashboard. See it work on a real problem. That is where confidence comes from.
Finance is not slowing down. But with the right stack, you will not need it to.
Learn Financial Modeling and Valuation at The Wall Street School and land the finance role you have been working toward.
