Picture this: Two analysts, same finance job, same starting line. One learns Excel, gets comfortable, stops. The other doesn’t. She picks up Python for the boring repeat stuff and Power BI so the numbers actually mean something to whoever’s looking at them. Fast forward a year. One’s still rebuilding the same model by hand every single quarter. The other’s done in half the time, dashboard ready, nobody chasing her for updates. Here’s the thing nobody tells you: no single tool wins the Excel vs Python vs Power BI debate for finance careers. Analysts build the core model using Excel for Financial Modeling, bring in Python for Finance for automation and lean on Power BI for Finance for live dashboards.
What Financial Modeling Tools do analysts actually use in 2026?
Ask ten finance professionals which of these Financial Modeling Tools matters most and you get ten different answers.
- Excel for Financial Modeling remains the backbone for almost every Indian finance role.
- Power BI for Finance sits on top of that Excel work and turns raw numbers into something a CFO can glance at in five minutes.
- Python for Finance comes in only when data gets too big for a spreadsheet and together these three tools make up modern Data Analytics for Finance.
For most FP&A or investment banking analysts in India, Excel still takes up most of the workday, usually more than half. The rest of the time is split between Power BI dashboards and some Python scripts for automation and handling data, based on how FP&A tool stacks and job listings typically look. This is why job postings now ask for Excel Financial Modeling and basic Data Analytics for Finance in the same paragraph, whether the role wants a fresher or a mid level analyst with sharper Financial Analyst Skills.
Why Excel for Financial Modeling still rules the desk?
Every three statement model, DCF valuation and quick sensitivity table built inside Indian finance firms starts with Excel for Financial Modeling. It is fast, everyone knows the basics and it lets an analyst test five scenarios before a coding environment even opens.
The learning curve for Excel Financial Modeling looks simple on paper but goes deep fast. Functions like INDEX MATCH, Power Query and Power Pivot separate someone with average Financial Analyst Skills from someone with genuine Financial Modeling Skills who can run a complete model end to end without help. That said, Excel does have real limits. Manual errors creep in easily, auditing a huge workbook is painful and once a dataset crosses a few hundred thousand rows, Excel starts to slow down or crash outright, which is a real gap in anyone’s Financial Analyst Skills if left unmanaged.
This is why firms are not replacing Excel Financial Modeling. They are simply adding Python for Finance and Power BI for Finance around it.
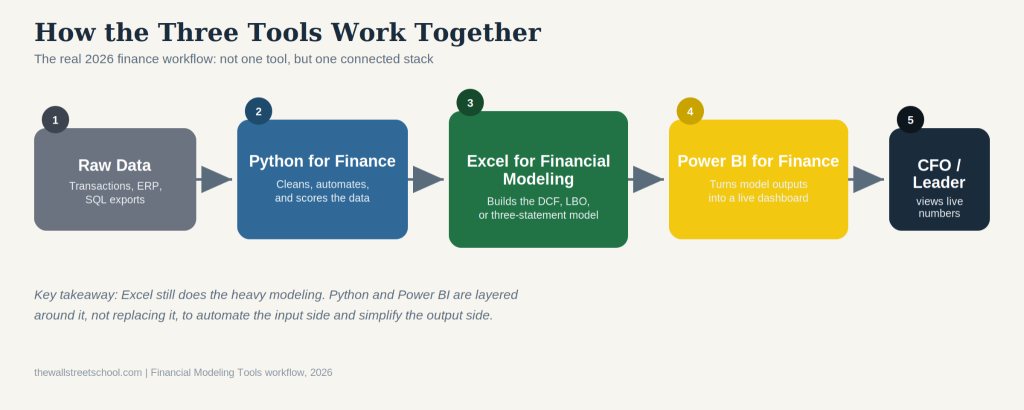
Figure 1: Financial Modeling Tools workflow: Python for Finance cleans data, Excel for Financial Modeling builds it, Power BI for Finance reports it.
A typical investment banking analyst still builds the deal model in Excel, then feeds the key numbers into a Power BI dashboard for senior management.
Where Python for Finance actually helps?
Python for Financial Analysis is not about ditching the spreadsheet skills you already have. It is about handling the parts that plain Excel genuinely struggles with, things like automating monthly reports, cleaning messy transaction data, running Monte Carlo simulations, or back testing an investment strategy across many years of data.
In most Indian finance teams, Python for Finance shows up more often in risk, treasury and quant research seats. For a fresher, strong Python for Financial Analysis knowledge is less of a strict requirement and more of a genuine differentiator when applying for FRM, quant, or Data Analytics for Finance roles. A credit risk team might use Python to pull loan level data, score it automatically, then push the output back into an Excel template the business already trusts.
With newer Python in Excel features, many analysts keep the spreadsheet as the front end while running heavier calculations through embedded Python code. Excel for Financial Modeling and Python for Finance are becoming teammates rather than rivals, good news if you want to grow real Financial Modeling Skills without abandoning what you already know.
How Power BI for Finance changes reporting?
Power BI for Finance is where the model finally talks to people outside the finance department. It connects to Excel files, SQL databases and ERP systems, then refreshes automatically so managers see live numbers instead of a static file emailed last week. A basic Power BI Course usually covers exactly this kind of connection and refresh setup early on.
Finance teams rely on Power BI for Finance for monthly performance packs, revenue dashboards and KPI scorecards shared with business heads who do not want to open a complicated Excel workbook. Where it struggles is cell level modeling logic, which is why the heavy modeling stays inside Excel while only the final view moves into a dashboard, a pattern any decent Power BI Course will teach you to respect.
Picture an FP&A analyst who maintains the full budget model in Excel but exposes only sales, margin and variance versus plan through a clean Power BI report for leadership. That split is the standard workflow across Indian corporate finance teams today and it is one reason a Power BI Course pairs so naturally with the Excel Financial Modeling skills an analyst already has.
Role wise priority among these Financial Modeling Tools
Figure 2: Excel for Financial Modeling vs Python for Finance vs Power BI for Finance usage by role in India, 2026
If you are aiming for investment banking or equity research, Excel Financial Modeling is non negotiable and Python for Financial Analysis is just a bonus. If you are leaning toward risk or quant work, flip that order and let Python for Finance lead your Financial Modeling Skills.
What to learn first if you are starting out?
For most finance students weighing these Financial Modeling Tools, the order in 2026 still looks the same. Start with Excel for Financial Modeling and go deep, covering advanced formulas, Power Query and basic VBA. Once that feels solid, take a proper Power BI Course so you can present your models to people who are not finance experts. Only after both feel comfortable should you pick up Python for Finance, since it opens doors that Excel Financial Modeling alone cannot reach.
Building genuine Data Analytics for Finance capability is less about mastering one tool and more about knowing which one to reach for at each stage of a task. That mindset, more than any single Power BI Course badge, is what separates strong Financial Analyst Skills from a resume that just lists software names.
People Also Ask about Financial Modeling Tools
- Is Python for Finance replacing Excel for Financial Modeling in 2026?
No. Python for Finance handles automation, but core modeling still happens inside Excel for Financial Modeling across almost every Indian finance role. - Do I still need Excel Financial Modeling if I know Power BI and Python?
Yes. Power BI for Finance and Python for Financial Analysis support reporting and automation but Excel remains where the model gets built. - Which Financial Modeling Tools should a finance student in India learn first?
Excel for Financial Modeling comes first, since strong Financial Analyst Skills in Excel are expected in nearly every finance interview. - How much Python for Financial Analysis is enough for FRM roles?
Enough to clean data and automate reports. Deep software engineering knowledge is not required to build these Financial Modeling Skills. - Is a Power BI Course better than Excel for reporting?
A Power BI Course suits live dashboards, while Excel Financial Modeling stays better for detailed, cell level work. - What is the biggest mistake analysts make with Financial Modeling Tools?
Trying to replace Excel entirely instead of layering Python for Finance and Power BI for Finance around it, which weakens real Data Analytics for Finance work.