How to Analyse a Quarterly Result in 15 Minutes?
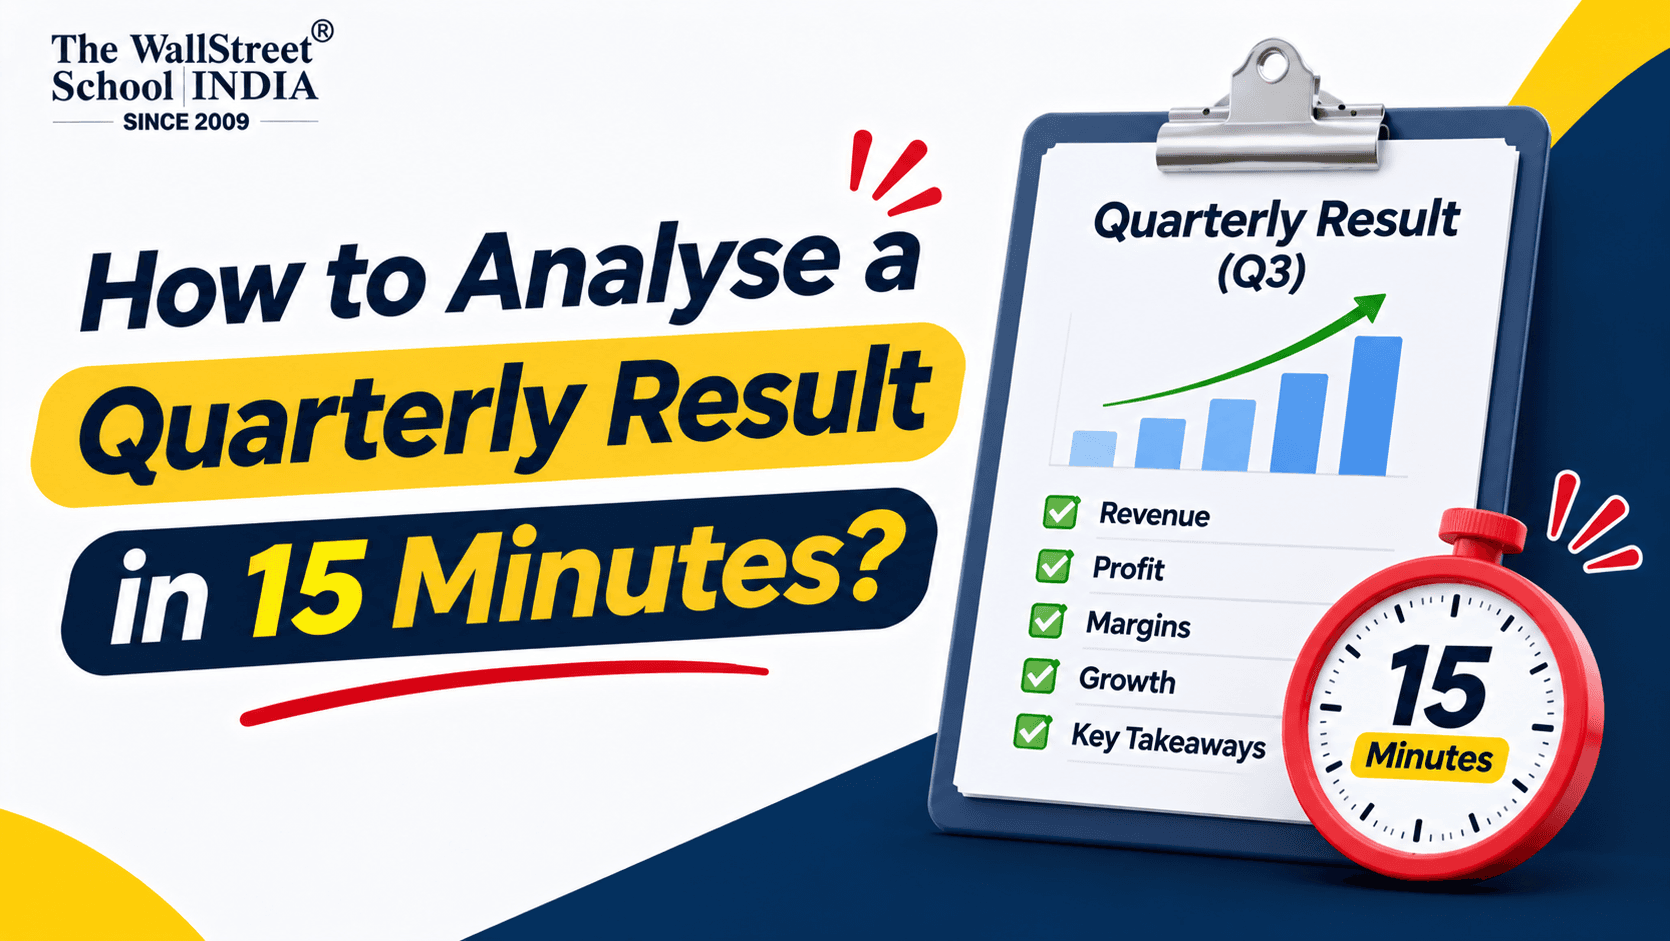
Profit up 35%. Great quarter, right? Not always. A headline like that can hide a one-time gain, thinning margins or cash that never actually came in. That’s why people who read results the right way o
Profit up 35%. Great quarter, right? Not always.
A headline like that can hide a one-time gain, thinning margins or cash that never actually came in. That’s why people who read results the right way often reach a different conclusion from the headline.
Using Asian Paints as an example, we'll walk you through what to compare, what to ignore and which numbers really matter when evaluating a company's quarterly performance.
Why Does Quarterly Results Analysis Matter?
Every listed company in India publishes quarterly results every three months. They are the most regular update on company earnings you will get.
One quarter is a small window. So the goal of financial analysis here is not to predict the future. It is to answer one question: is this profit real and will it repeat? Good earnings analysis starts with one habit: compare first, then question.
You can find the results on the company's website or on the BSE/NSE websites under corporate announcements. Keep the press release open next to you.
How to Analyse Quarterly Results?: The 5-Step Checklist
Here is how to analyse quarterly results in the right order. Each step has a time limit, so this quarterly results checklist fits in 15 minutes.
Fig 1: Quarterly results checklist: 5 steps in 15 minutes, from headline numbers to guidance and capex
Step 1: Revenue Growth Analysis and Headline Numbers (3 minutes)
First, check the basis. Companies with subsidiaries publish standalone and consolidated numbers. Pick one and stay with it. Not sure which? Our guide on standalone vs consolidated results explains it in simple words.
Now take four numbers: revenue, operating profit (EBITDA), PAT and EPS. Compare each with the same quarter last year (YoY), which removes seasonal effects and the previous quarter (QoQ), which shows momentum.
Start any revenue growth analysis with sales, the cleanest number in company earnings. Then look at the gap between sales growth and profit growth. If profit grows much faster or slower than sales, something else is at work. The next steps find out what.
Step 2: Separate Real Profit from One-Off Profit (3 minutes)
Operating profit comes from running the business. Other income (interest on cash, investment gains) does not. Exceptional items are one-time events, like selling land or a write-off.
Ask: is the profit growth operational or one-off? Find the “exceptional items” line and read the notes under it. If there is a one-off, remove it after tax before judging PAT and EPS. Also check how much of the profit rise came from higher other income.
Check the tax rate too (tax divided by profit before tax). A sudden low rate can lift profit without any real improvement.
This one check improves any quarterly results analysis more than any other because it shows the quality of company earnings. Honest earnings analysis starts here.
Step 3: Profit Margin Analysis (4 minutes)
Now do a profit margin analysis. Look at gross margin, operating margin and PAT margin over the last four or five quarters, not just two. Then ask what drove the change:
Raw material cost. Check gross margin first. If it falls while sales rise, input costs (metals, chemicals, packaging) grew faster than selling prices. Then ask: can the company raise prices soon or will this pressure last?
Employee cost. Divide employee cost by revenue. If that share keeps rising for a few quarters, margin shrinks even when sales are good. A one-time bonus is different from a steady rise.
Operating leverage. Fixed costs like rent, salaries and depreciation do not rise with every extra rupee of sales, so margins should improve as sales grow. If sales rise 15% and margin still falls, costs are growing faster than the business. That is a warning sign.
A short spike in input prices is very different from a company losing its pricing power. Good profit margin analysis tells you which one you are looking at. It is the heart of any stock analysis.
Step 4: Debt, Working Capital and Cash Flow (3 minutes)
This step of financial analysis checks if profit turns into cash.
Debt. Compare total borrowings with last quarter and check the interest cost. Rising debt is fine if it builds a new plant. It is a worry if it funds daily running costs or if interest takes a bigger share of operating profit.
Working capital days. Check inventory days (how long stock sits unsold) and receivable days (how long customers take to pay). Longer days mean cash is stuck. If receivables rise faster than sales, the company may be giving easy credit just to push sales.
Operating cash flow vs PAT. Over a year, the two should be close. If cash flow stays well below profit for two halves in a row, the profit is mostly on paper. Find the reason: stock build-up, slow-paying customers or a one-time item.
Companies file the full cash flow statement with half-yearly results (September and March), so check it in those quarters. Even a perfect profit-margin analysis means little if cash doesn't follow.
Step 5: Guidance, Capex and Order Book (2 minutes)
The first four steps look backward. This one looks ahead. Read the management commentary or earnings call summary.
Guidance. Note the exact number management gives (growth or margin) and compare it with the last four quarters. If it needs a big jump from today’s pace, ask what will change to make that happen.
Capex plans. Check three things: the amount, the purpose (new capacity, cost saving or just upkeep) and the funding (debt or own cash). Big capex funded by debt, without sales growth to back it, is a risk.
Order book. Compare it with yearly revenue. An order book about twice the annual revenue gives roughly two years of visibility. Also check whether fresh orders are coming in or the company is only delivering old ones.
Good financial analysis checks revenue growth analysis against guidance this way. Also compare last year’s guidance with what happened. A management that keeps missing its own targets deserves less trust.
Let’s Understand Through an Example: Asian Paints Q2 FY27
Now let’s apply the five steps to Asian Paints and its Q2 FY27 result (July to September 2026). We use consolidated numbers in Rs crore.
Item | Q2 FY27 | Q2 FY26 | Q1 FY27 |
Revenue from operations | 9,977 | 8,531 | 10,542 |
Other income (about) | 248 | 199 | 241 |
Profit before tax (PBT) | 1,436 | 1,353 | 2,058 |
PAT after minority interest | 1,068 | 994 | 1,539 (PAT after minority interest) |
EPS in Rs (about) | 11.1 | 10.4 | 16.1 |
Step 1: Headline numbers. Revenue grew 16.9% YoY. Operating profit (the company calls it PBDIT) grew only 3.6%, from Rs 1,503 crore to Rs 1,557 crore. PAT grew 7.5% and EPS rose from about Rs 10.4 to Rs 11.1.
QoQ looks ugly: revenue fell 5.4% and PAT fell about 31% from Q1. But July to September is usually a softer quarter for paints because of the monsoon, so YoY is the fairer comparison. This is why you need both. The gap is clear: sales up 17%, operating profit up under 4%. Costs are eating the growth.
Step 2: Real vs one-off profit. Other income was about Rs 248 crore, up from about Rs 199 crore. PBT rose by about Rs 83 crore and about Rs 49 crore of that came from higher other income. Take it out and PBT growth is about 2.6%, not 6.1%.
Exceptional items can swing profit a lot, so always read that line and the notes under it. In Q2 FY27, the consolidated filing shows exceptional items of Rs 0, so there is no one-off to remove. The tax rate is about 27%, close to the usual rate so nothing odd there.
Step 3: Margins. Operating margin fell from 17.7% to 15.6%. PAT margin slipped from about 11.6% to 10.7%. Gross margin was about 39.7%, down about 347 bps YoY. Management has guided to a 41% to 43% gross margin band for FY27 as price increases come through. What drove it? Mostly raw material costs: higher input prices, with price increases coming in too slowly to cover them. A new anti-dumping duty on titanium dioxide, a key paint ingredient, took effect on 24 October, after this quarter, so it is a risk for Q3 and Q4, not a cause of the Q2 fall. Management did not point to employee cost as the problem. And there was no operating leverage: sales rose 17%, yet margin fell.
Step 4: Cash. Asian Paints held about Rs 5,510 crore in cash and equivalents at the end of September, so debt is not the worry. Cash flow is. More money went into inventory and customer dues. In April to September, PAT was Rs 2,607 crore but operating cash flow was Rs 1,900 crore, about 73 paise of cash per Rs 1 of profit. A year ago, cash flow (Rs 3,482 crore) was well above profit (Rs 2,093 crore). Profit grew about 24.5% in the half year, while operating cash flow fell about 45%.
Fig 2: Asian Paints company earnings: first-half profit of Rs 2,607 crore against operating cash flow of Rs 1,900 crore.
Working capital shows the same story. Inventory rose from about Rs 5,744 crore in March to Rs 7,263 crore in September, a jump of roughly 26% in six months. On Q2 sales, that works out to about 67 days of stock (our calculation, inventory divided by quarterly sales, times 92 days). Trade receivables rose from Rs 4,462 crore in March to Rs 5,049 crore in September. That increase is modest next to the inventory build-up, so the bigger working-capital cash drain in H1 was inventory, not customer dues.
Step 5: Looking ahead. Management kept its 18% to 20% EBITDA margin guidance. The quarter came in at 15.6%, so the company has catching up to do and it expects price increases and cost savings to help. On capex, strong cash means funding is not a worry. Order book does not apply: a paint company sells off the shelf.
Putting it together: the revenue growth analysis shows real strength. The profit margin analysis shows pressure. Other income helped profit and cash flow weakened, so company earnings are of average quality. Our reading: a strong sales story with a margin problem, worth watching, not a reason to rush. A quarterly results analysis will not tell you to buy or sell. It tells you what is really going on. That is the whole point of earnings analysis.
Why Can a Stock Fall After Good Quarterly Results?
A company can post good numbers and the share price can still fall. Share prices react to quarterly results against what the market expected, not against last year. If analysts expected 25% profit growth and the company delivered 20%, the stock can drop. Weak guidance, shrinking margins or a one-off gain behind the profit can do the same. A good stock analysis judges the quality behind the headline.
Quarterly Results Checklist
Save this quarterly results checklist. It is how to analyse quarterly results in 15 minutes, every time:
Basis, revenue, EBITDA, PAT, EPS: YoY and QoQ (3 min)
Other income, exceptional items, tax rate (3 min)
Gross, EBITDA and PAT margins (4 min)
Debt, working capital days, operating cash flow vs PAT (3 min)
Guidance, capex plans order book (2 min)
4 Mistakes Beginners Make in Earnings Analysis
1. Reading only the PAT headline
A profit jump looks great until you open the notes. Check other income and exceptional items first. If a company sold land or booked a one-time gain, PAT can rise while the core business stays flat. Look at operating profit (EBITDA) and margins to see what the business actually earned.
2. Comparing only with the previous quarter
Q3 usually looks strong for consumer and retail companies because of festive demand and Q4 looks weak next to it. That doesn’t mean anything went wrong. Compare with the same quarter last year (YoY) so seasonality doesn’t fool you and check whether growth came from higher volumes or just price hikes.
3. Skipping cash flow
Profit is an accounting number, cash is real. If PAT keeps rising but operating cash flow doesn’t, look at receivables and inventory. Money stuck with customers is a warning sign, because the company has to fund that gap with debt.
4. Judging one quarter alone
One good or bad quarter can be a blip. Line up the last four to eight quarters and look at the direction of revenue, margins and cash flow. Then read the management commentary to see if what they say matches the numbers.
Before you trust any result, ask one question: is this profit repeatable and backed by cash?
Key Takeaways
How to analyse quarterly results in 15 minutes: follow the order of growth, quality, margins, cash and future.
Remove other income and one-offs before judging company earnings. This is the core of earnings analysis.
Use this quarterly results checklist for every stock analysis and your quarterly results analysis gets sharper each quarter.
Ask one last question: does this quarter change why I own or want this stock?
Want to Go Beyond the Checklist?
Knowing how to analyse quarterly results is the first step in financial analysis. It is how you read company earnings like an analyst. But reading numbers is only half the job. The real skill is using them to build a financial model and work out what a company is worth.
That’s what we teach in our flagship Financial Modeling and Valuation course at The WallStreet School. You will learn to build a model from a company’s financial statements and turn it into a valuation you can explain and defend.
If you want to move from reading quarterly results to working with them, this is the next step.
Explore the Financial Modeling and Valuation Course at The WallStreet School
People Also Ask About Quarterly Results Analysis
1. How to analyse quarterly results quickly?
Follow five steps: headline growth, other income and one-offs, margins, debt and cash flow and guidance. A good quarterly results checklist finishes this in 15 minutes.
2. What is the most important part of earnings analysis?
Check if profit is operational or one-off. Strip out other income and exceptional items before any financial analysis of company earnings.
3. Why does a stock fall after good quarterly results?
Prices move against expectations. Weak guidance, falling margins or a one-off gain can outweigh a good headline in any stock analysis.
4. Is quarterly results analysis enough for stock analysis?
No. It is the first filter. Add valuation, industry trends and the company’s long-term record.
Sources
Asian Paints Q2 FY27 consolidated integrated filing, NSE — Q2 FY27 and Q2 FY26 revenue, other income, PBT, exceptional items, tax, PAT, EPS, balance-sheet items, and H1 cash flow.
Asian Paints Q2 & H1 FY27 board outcome / press release, NSE — net sales, PBDIT, operating margin, PAT margin, and management commentary.
Asian Paints Q1 FY27 consolidated integrated filing, NSE — Q1 FY27 revenue, other income, PBT, PAT after minority interest, and EPS.
Asian Paints Q1 FY27 XBRL data, NSE — detailed Q1 FY27 figures.
Asian Paints Q1 FY27 press release — Q1 net sales, PBDIT margin, and gross margin.
Asian Paints Q2 FY27 investor-conference transcript, NSE — gross margin, raw-material commentary, TiO2 duty timing, and FY27 guidance.
This article is for education only and is not investment advice.
Interested in Learning Finance Professionally?
Our courses take you from fundamentals to expert level — with live mentors and placement support.
Explore Our Courses